

Insights is a Prod Pack feature, also included in Enterprise plans. Databases without Prod Pack see the tab with sample data, so you can explore it before you enable Prod Pack. Insights is not available for databases created through Fly.io, Heroku or DigitalOcean.
Traffic
Request routing
Upstash serves requests from the region closest to the client. This section shows where each request entered and which region of your database answered it.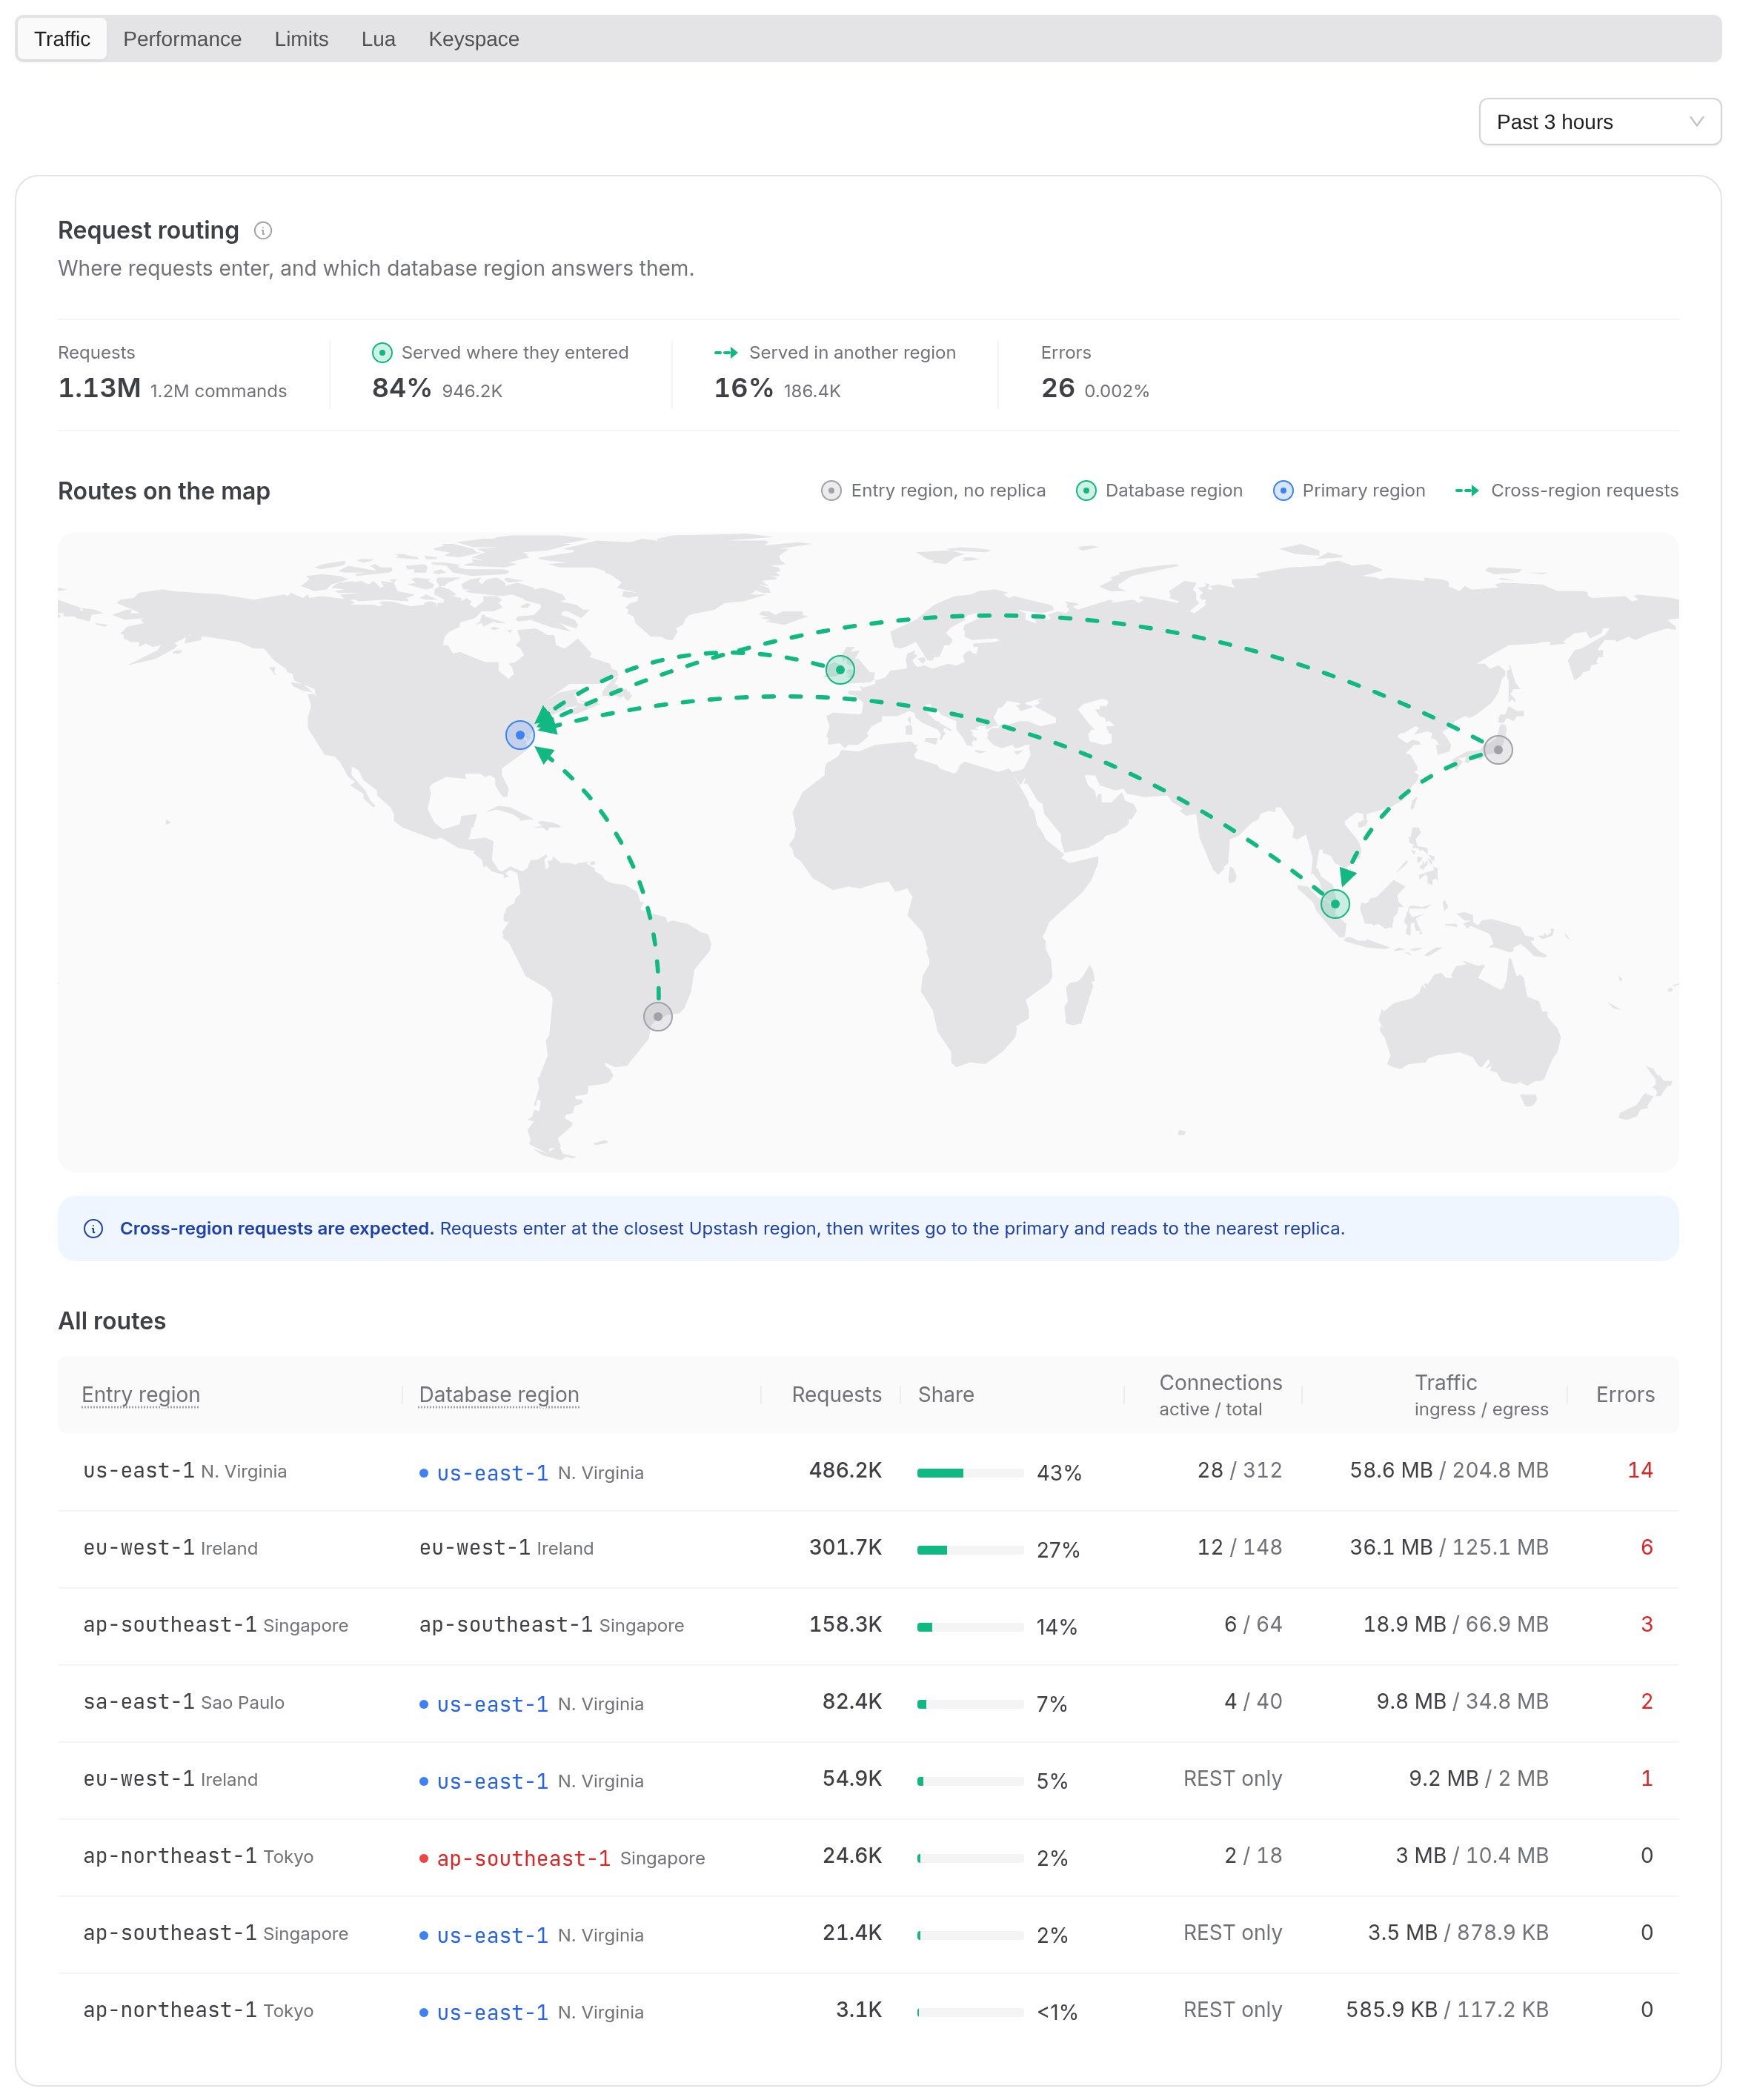
- Requests: total requests in the period, how many were served in the region where they entered, how many were served in another region, and how many failed.
- Routes on the map: each route from an entry region to the database region that served it. Dashed arrows are cross-region requests.
- All routes: each route with its request count, share of requests, active and total connections, ingress and egress traffic, and errors.
Where clients connect from
The IP ranges your requests came from, busiest first, with the cloud and region each range belongs to. Ranges are matched against the IP ranges that AWS, Google Cloud and Cloudflare publish. Serverless platforms show up as the cloud they run on, for example Vercel functions as AWS.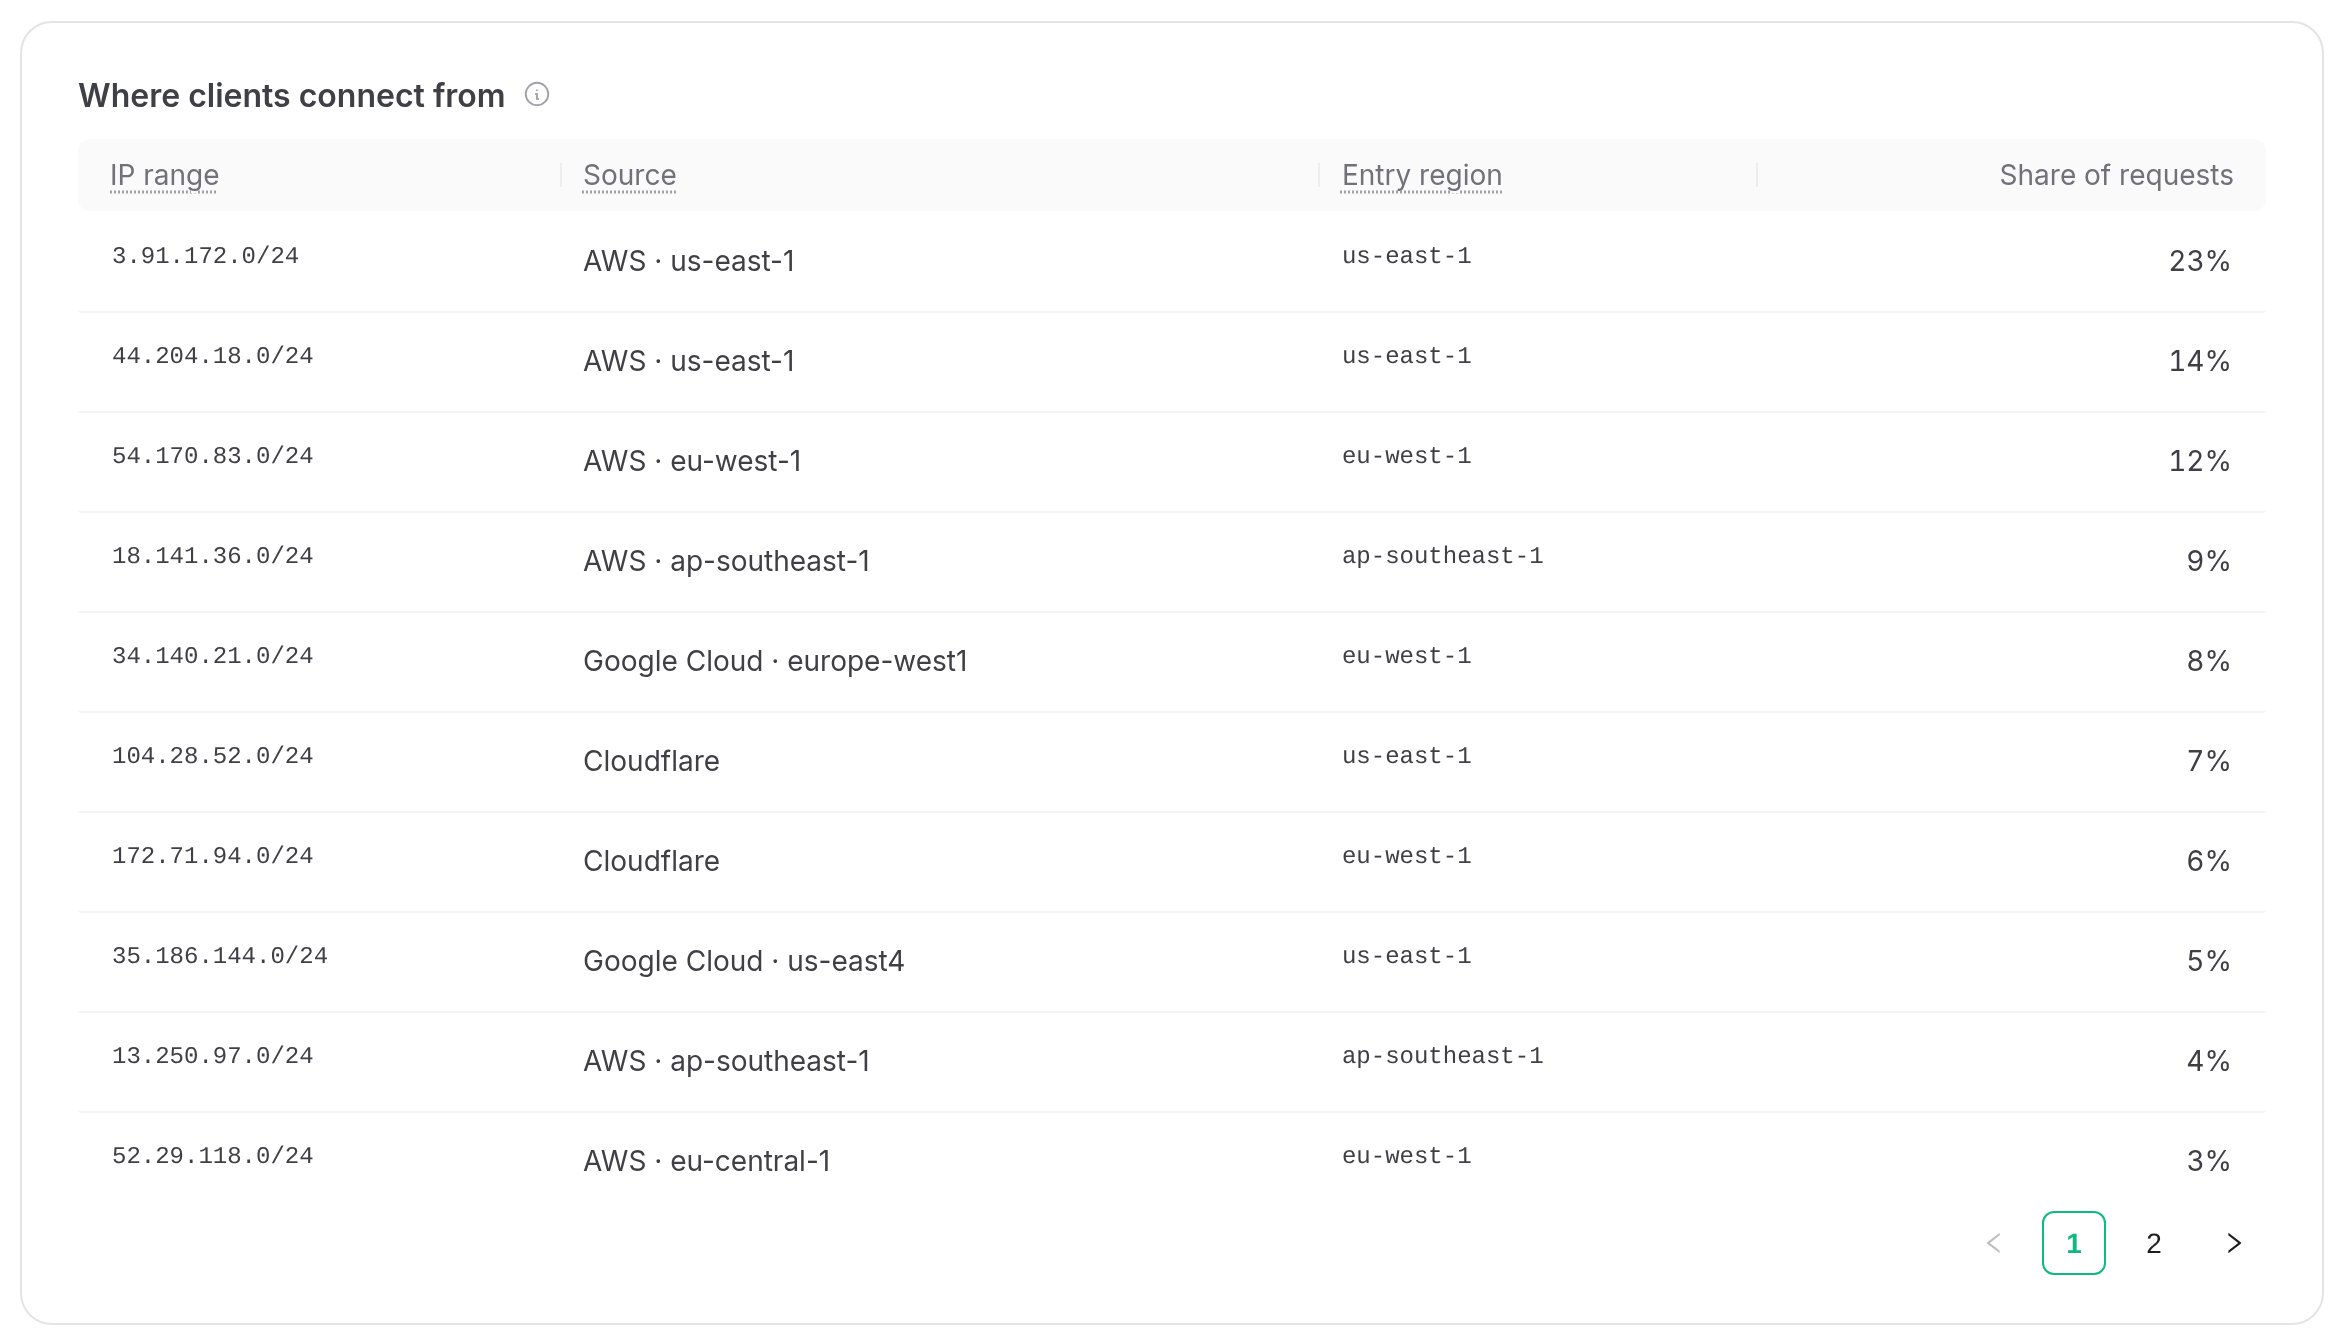
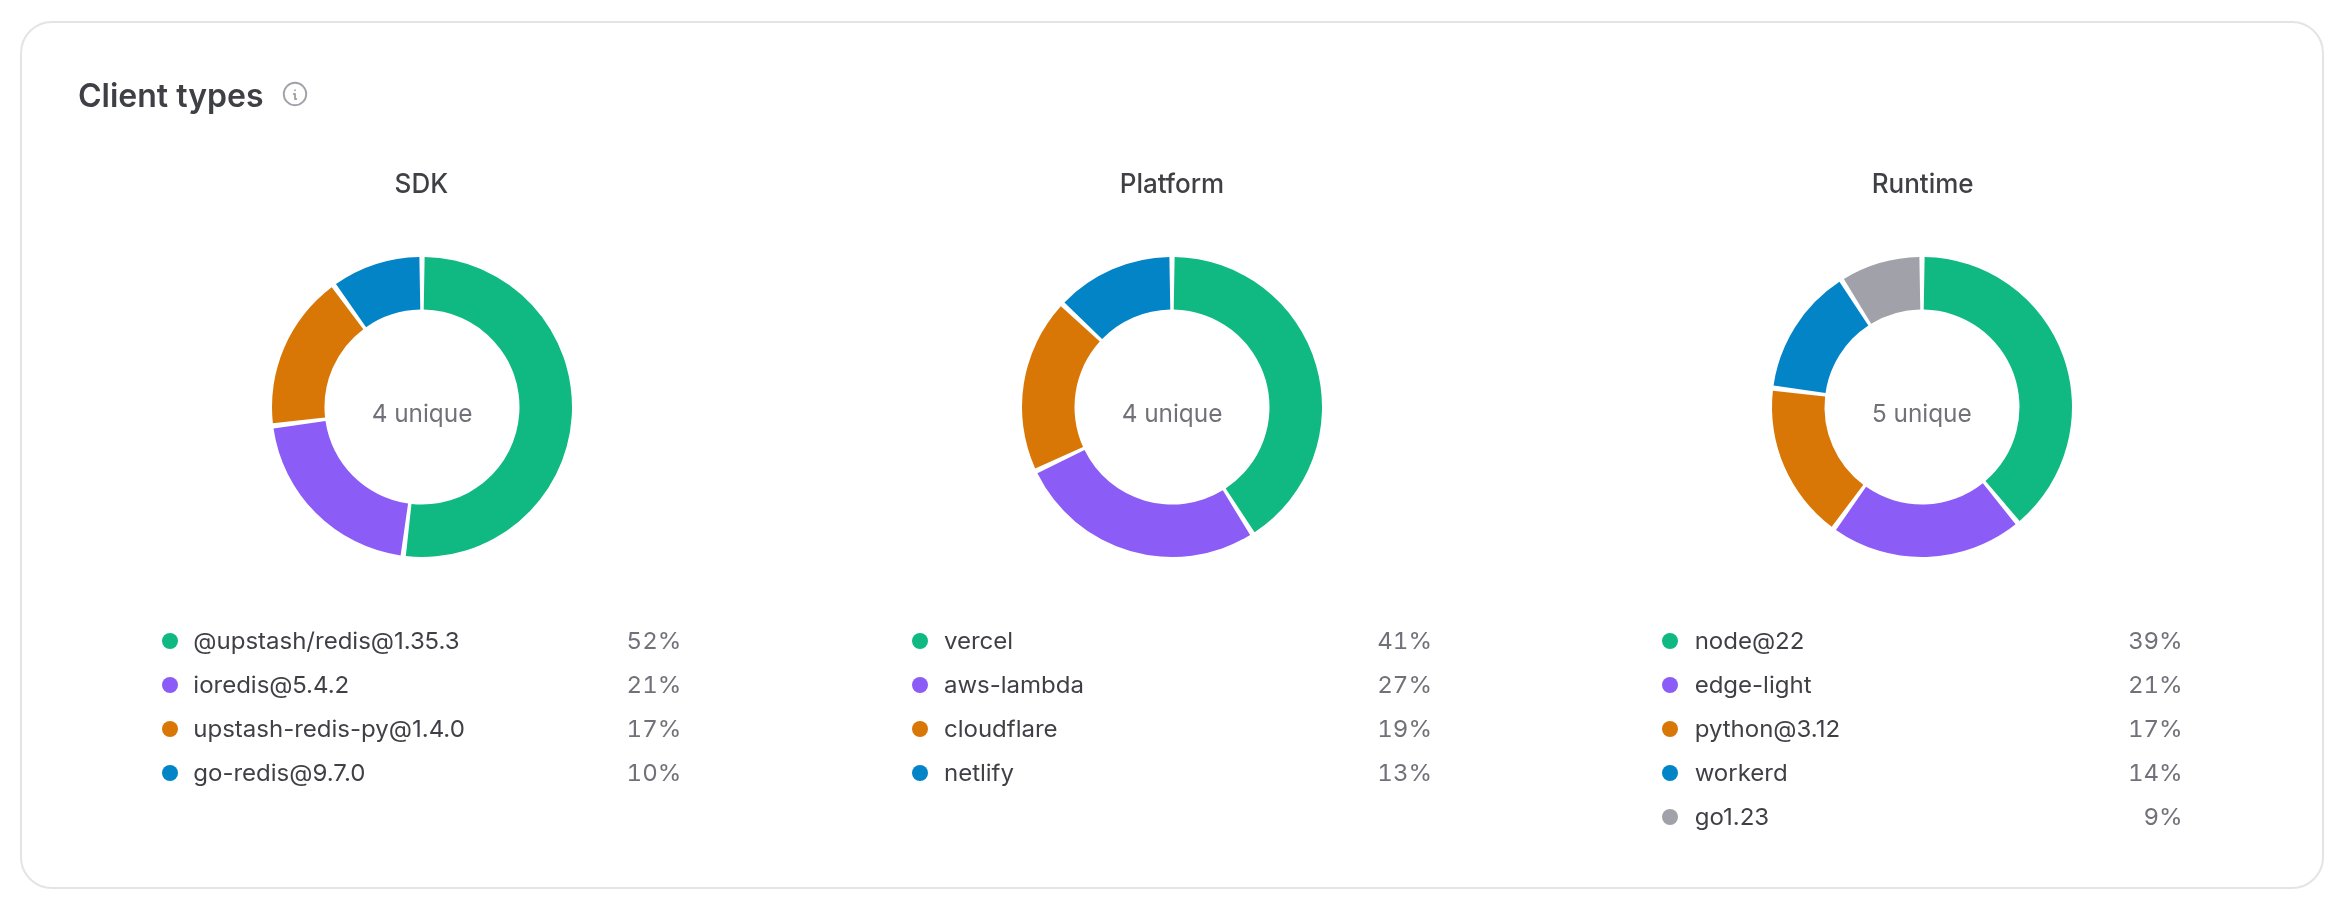
Client types
The SDKs, platforms and runtimes your clients use, from the telemetry headers that Upstash SDKs send. For TCP clients, the SDK is the library name they declare withCLIENT SETINFO.
Performance
Charts of throughput, bandwidth, disk size and latency. Pick a replica in the top-left corner to see a single replica instead of all of them. The Simple service latency chart has its own picker for the p50, p90 and p99 percentiles.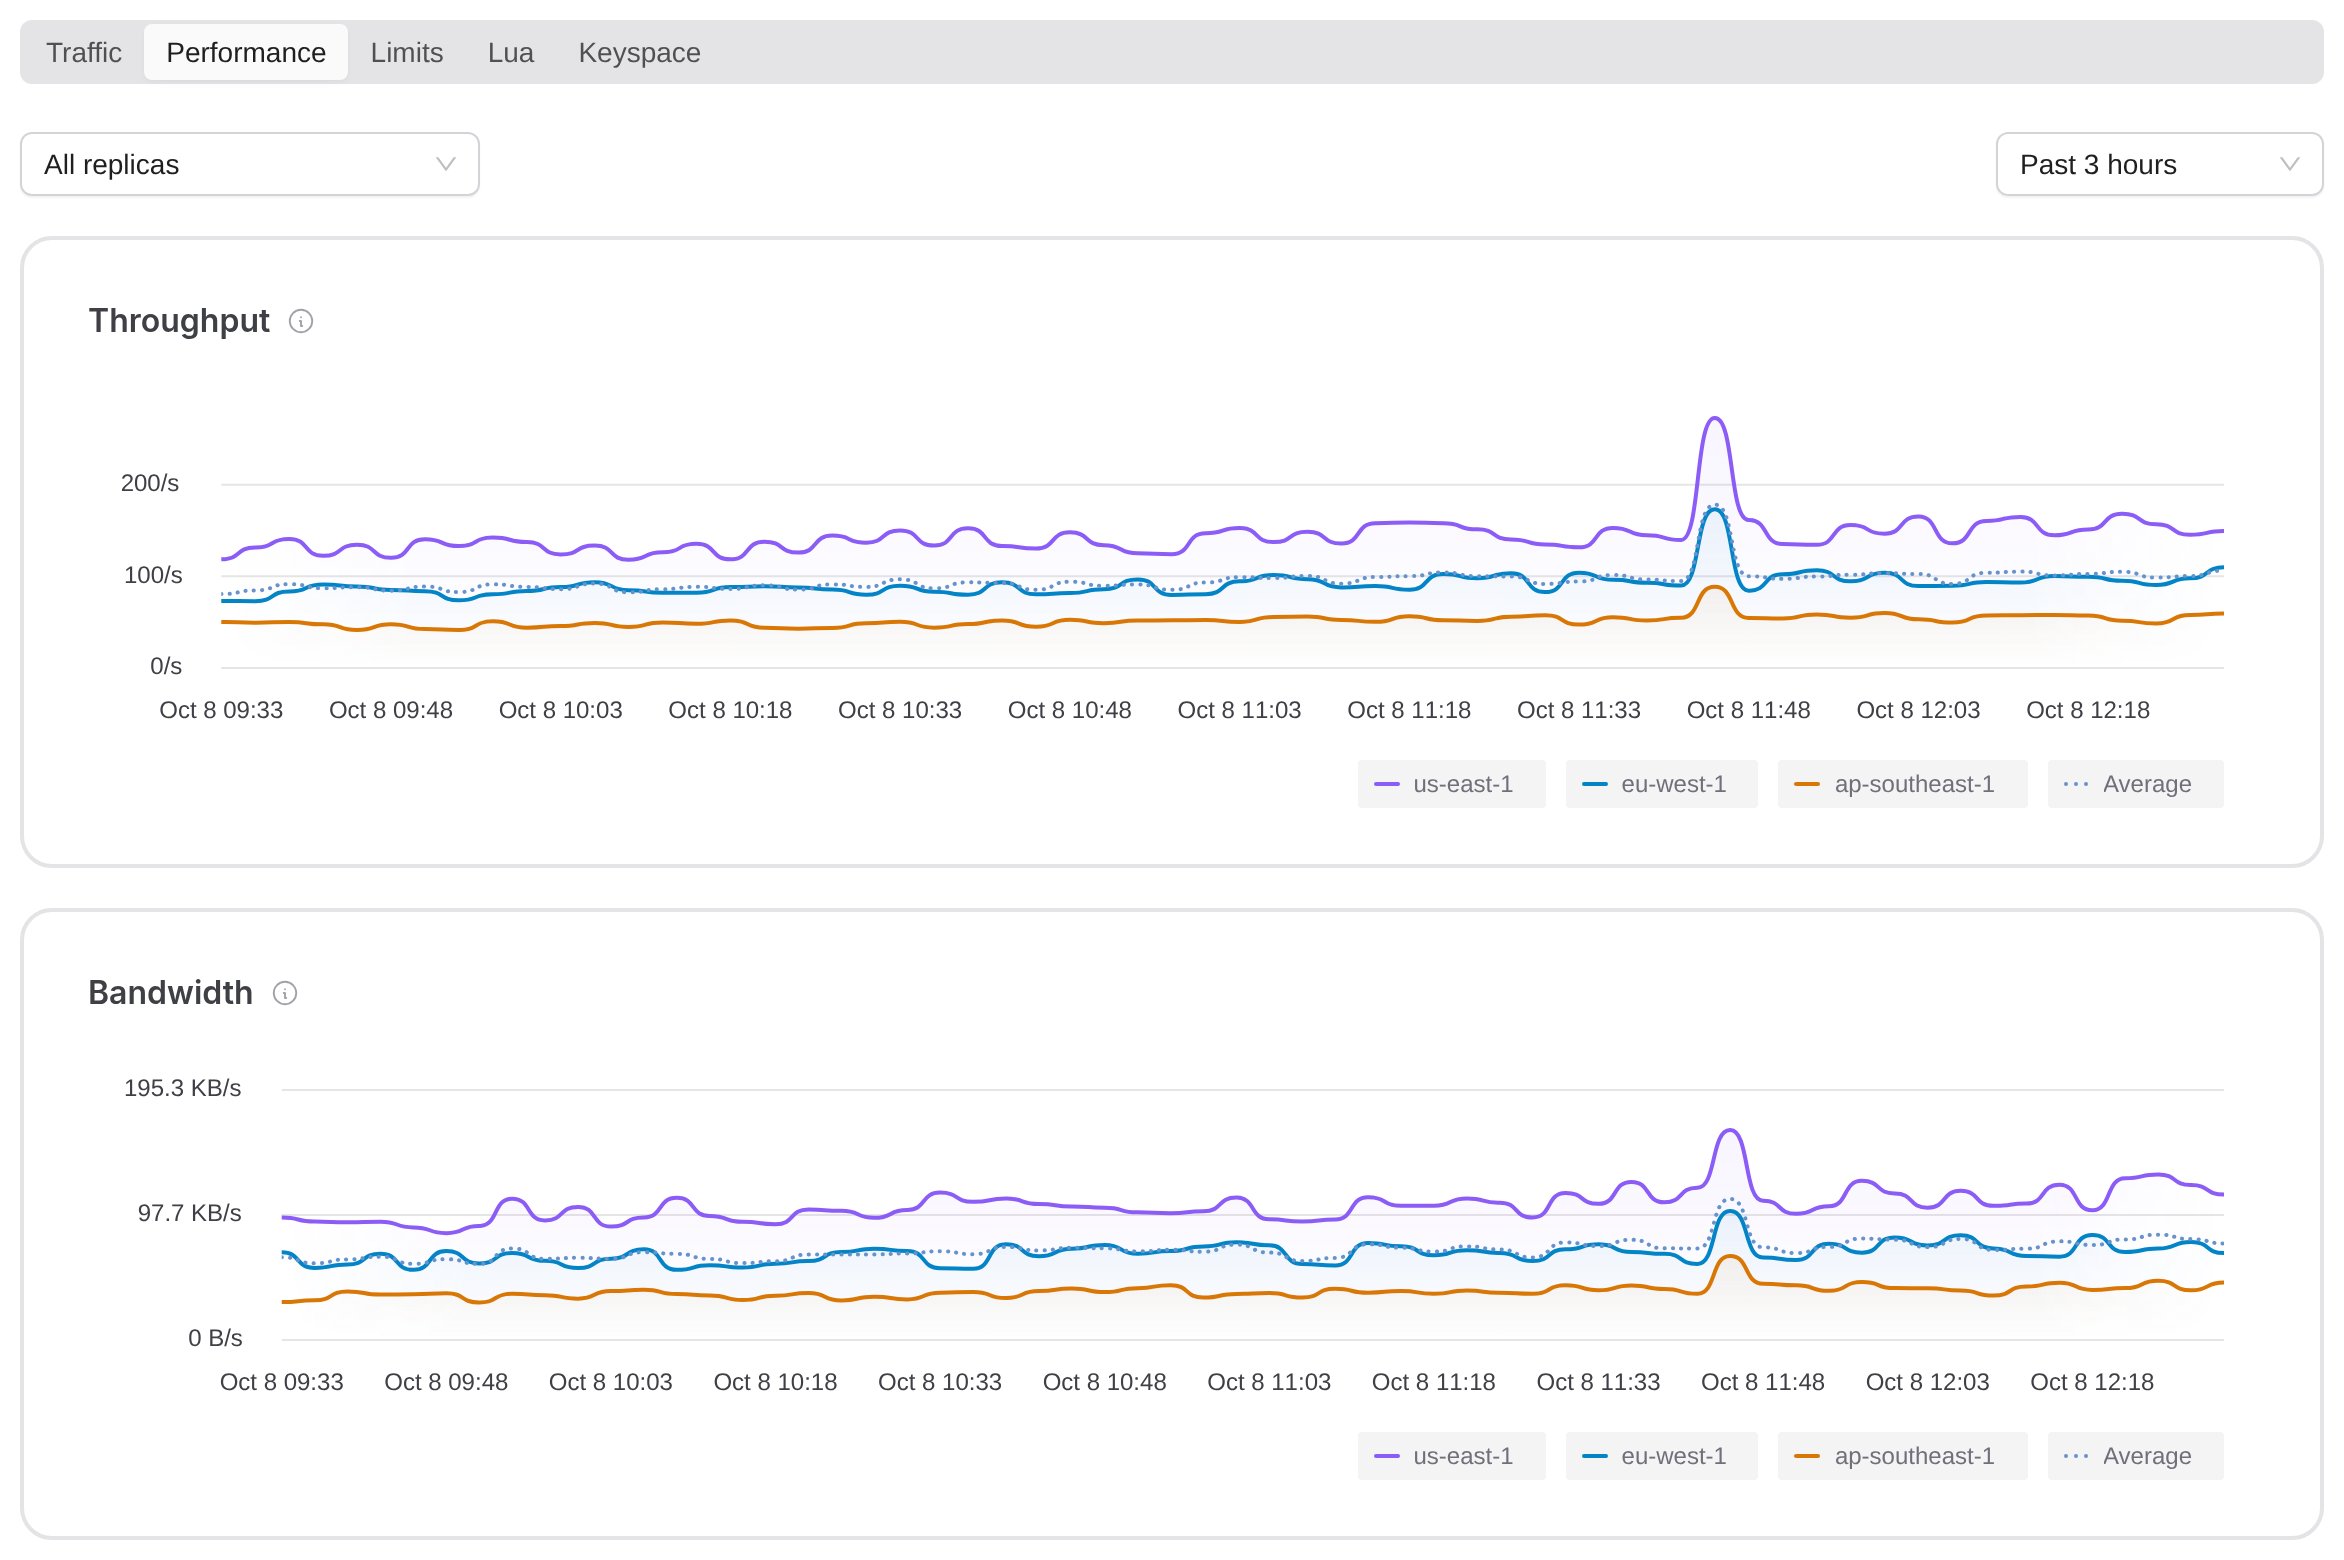
Limits
How close the database is to the limits of its plan, and the requests a limit refused or delayed.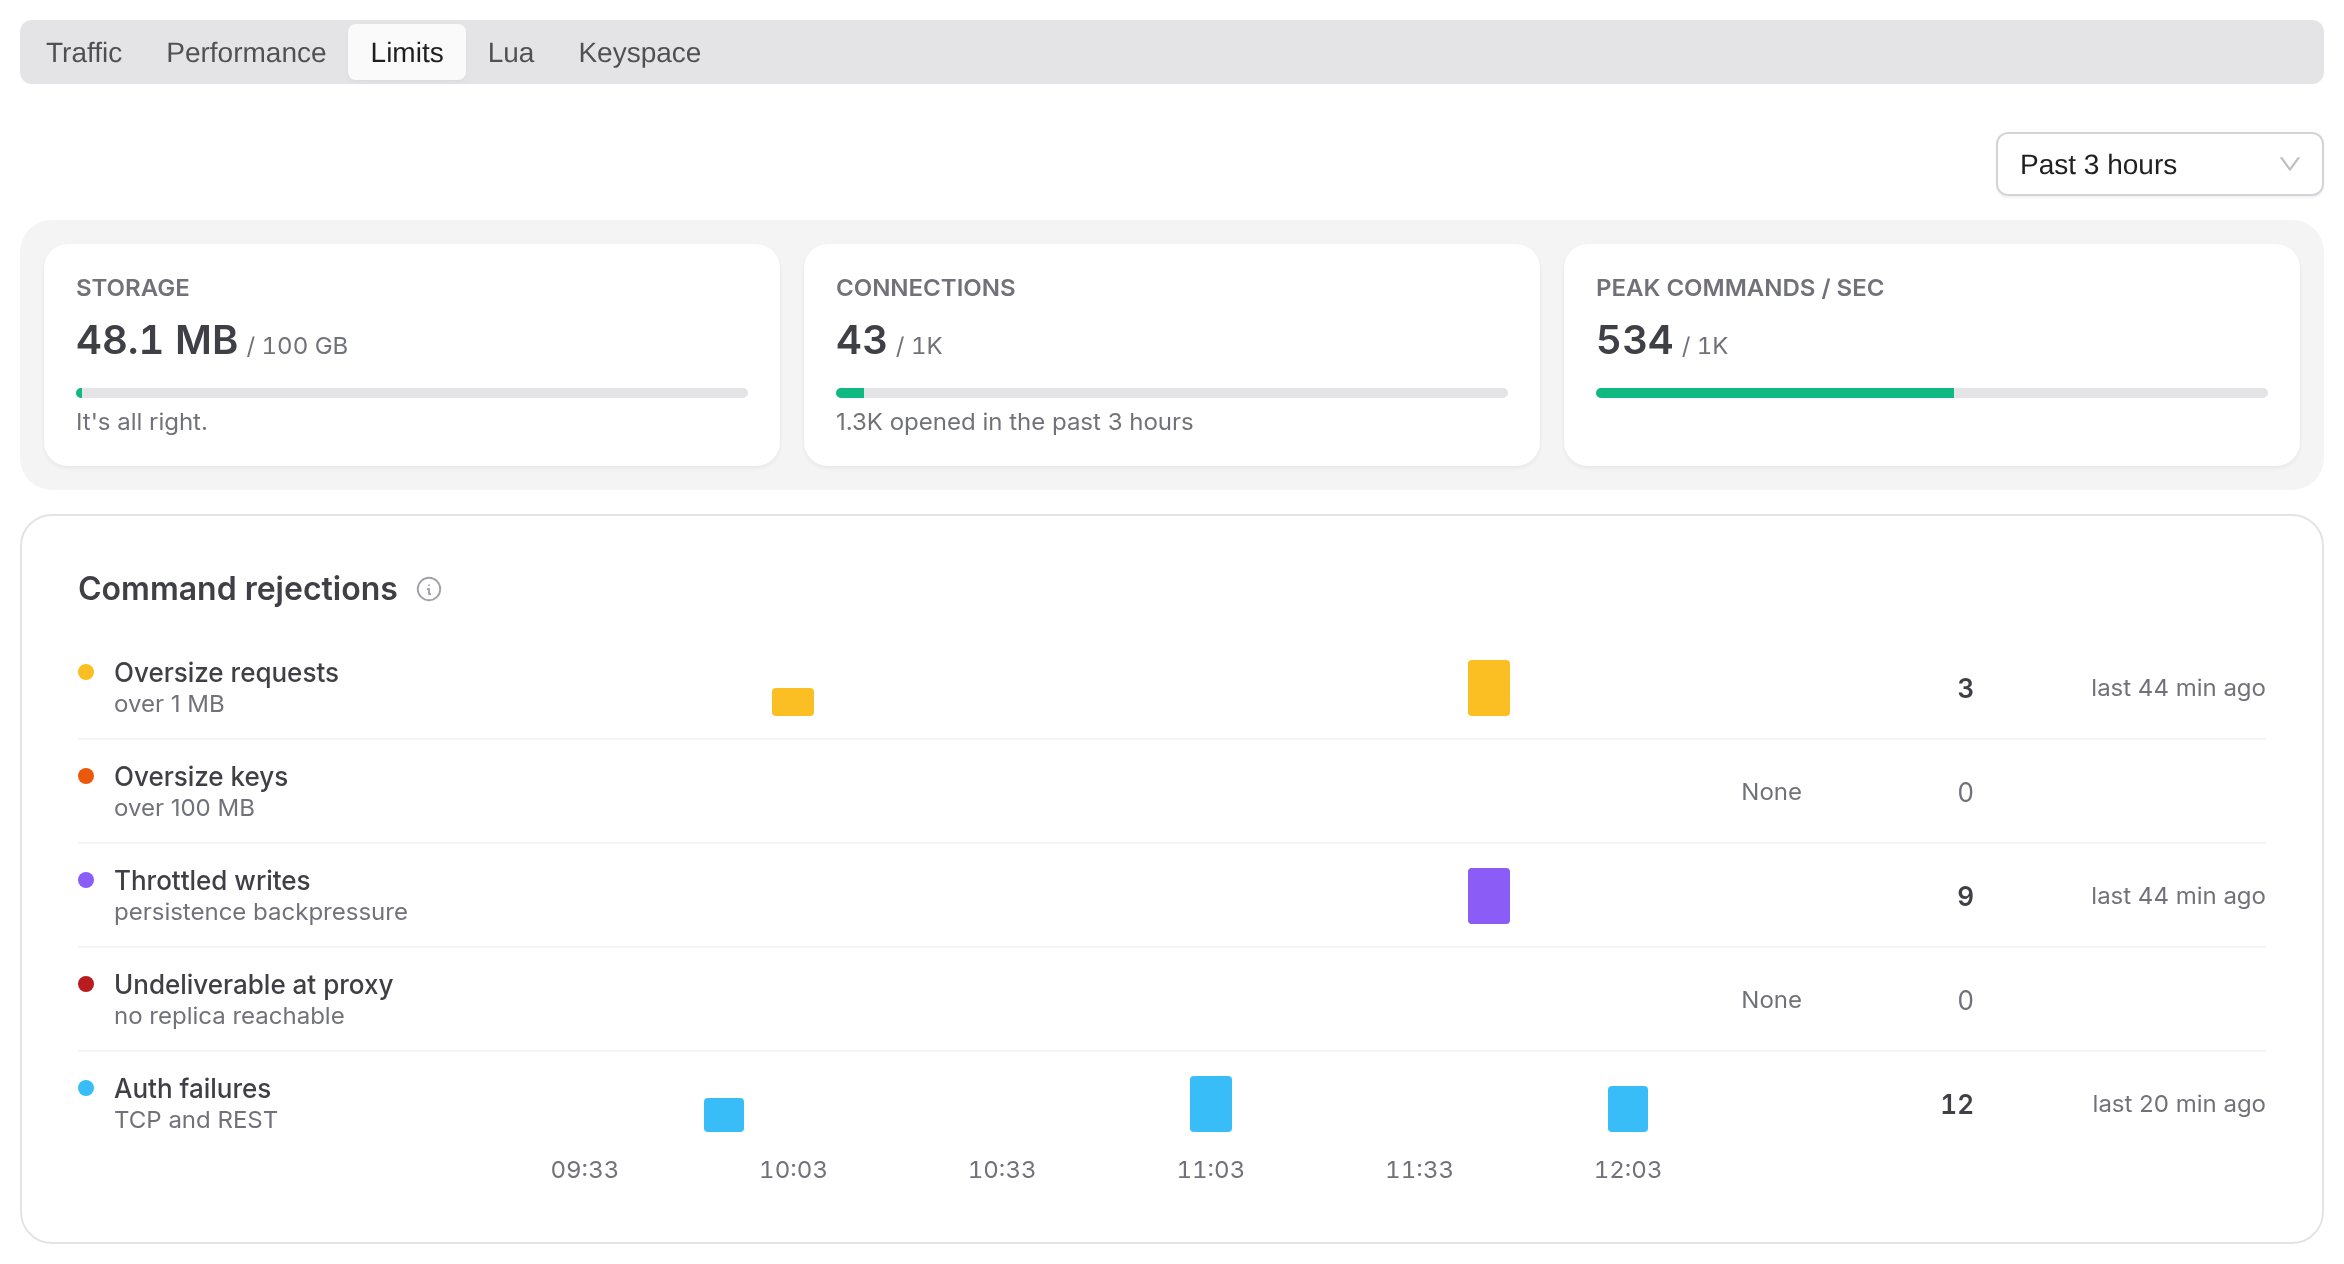
- Storage, Connections and Peak commands / sec: current usage against the limit of the plan.
- Command rejections: requests refused or delayed because of a limit, such as oversize requests, oversize keys, throttled writes, requests that could not reach any replica, and authentication failures. Each row shows when the rejections happened, how many there were, and when the last one was.
Lua
Script counters, Lua latency, and the scripts that run most often.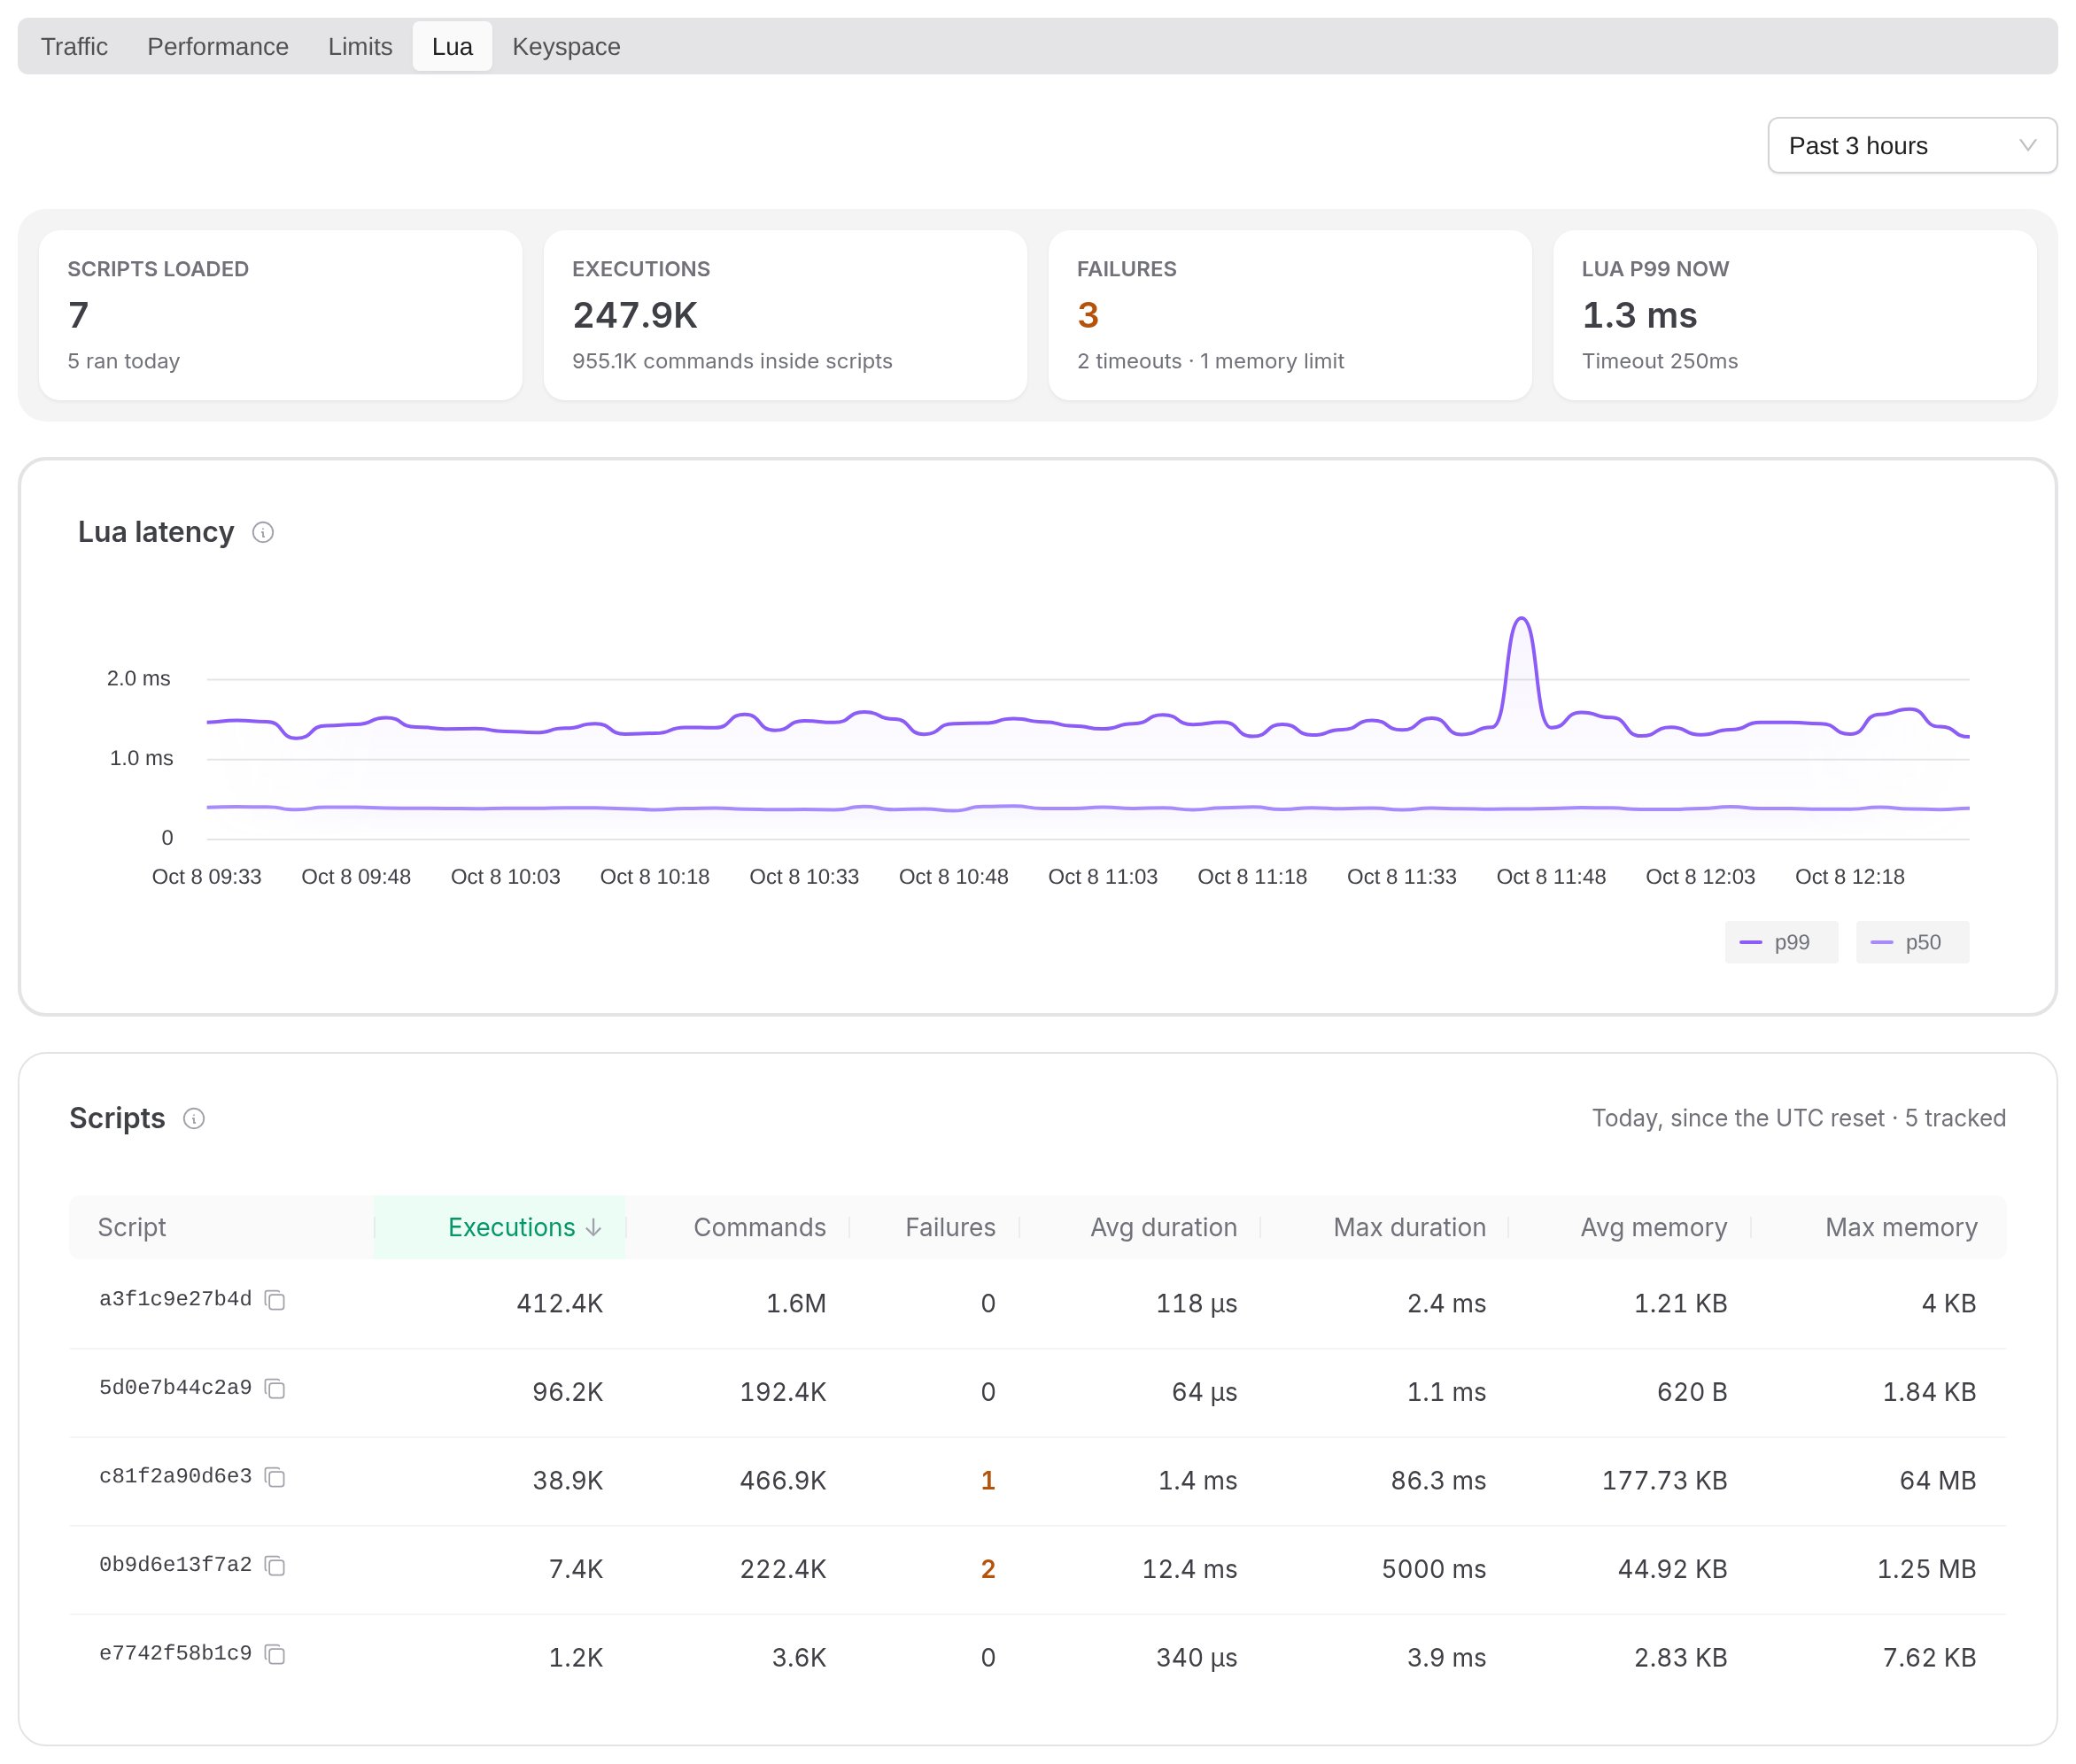
Keyspace
An analysis of what your keys hold, made from an offline scan of the latest daily backup. It does not run any command on your database.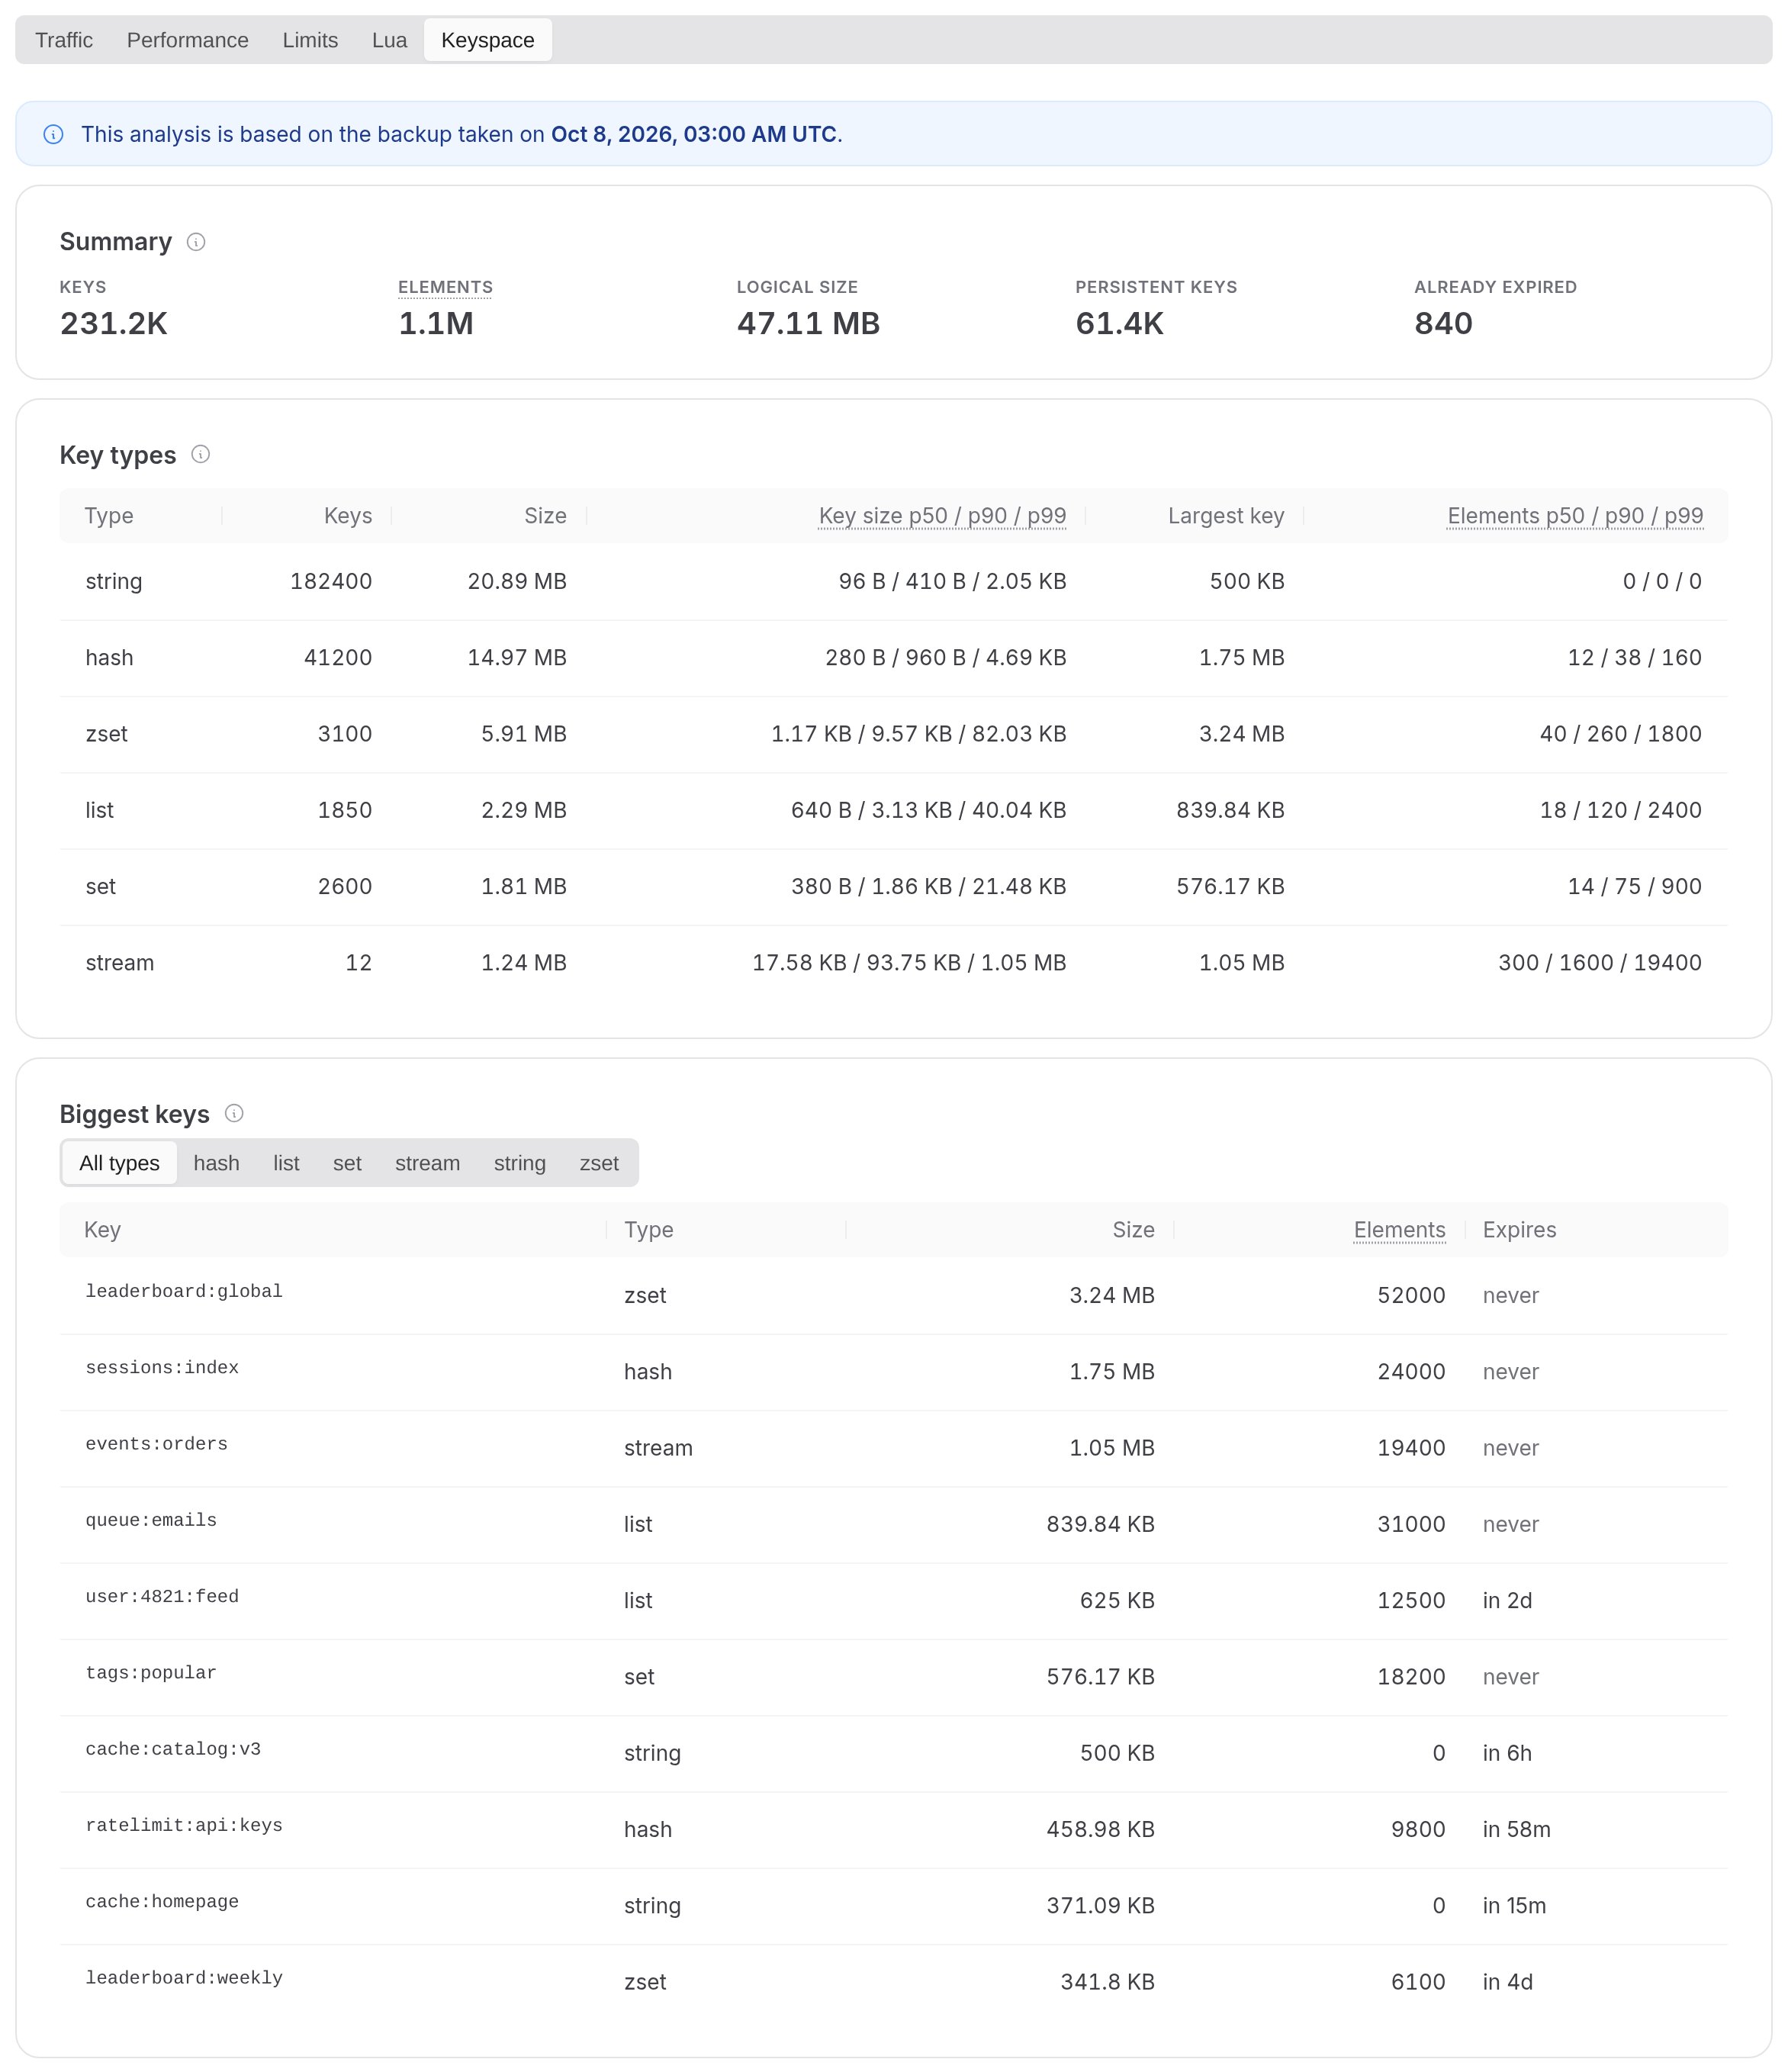
- Summary: number of keys and elements, logical size, keys without a TTL, and keys that had already expired.
- Key types: for each Redis data type, the number of keys, their total size, key size and element count percentiles, and the largest key.
- Biggest keys: the ten largest keys, with their type, element count and remaining TTL.
- Expiration profile: keys grouped by remaining TTL.